If you really want to get the most out of your DewK, LogWare III is an investment worth every penny. As client- server or stand-alone software,
it remotely monitors and logs an unlimited number of concurrent log sessions into a single database. That means data from many DewKs can be
managed in real time via Ethernet, RS-232, or wireless connections.
LogWare III allows you to customize your graph trace color, alarms, and statistics as you go. You can start/stop log sessions and modify sample
intervals from your computer. LogWare III supports "hot-swapping," which allows you to remove and replace sensors without shutting down the
log session. LogWare III also supports security features such as passwords for individual users or groups/teams, a built-in administrator account,
pre-defined user groups, and customizable permissions.
Never again be the last to know about a problem. Customizable e-mail settings allow you to send e-mails to designated recipients, including cell
phones and PDA's, when a log session begins, ends, or is aborted; when the DewK's battery is low; when a sensor calibration is due; or when a
temperature/humidity alarm is exceeded.
If you cannot be reached via email, you can always arrange to be paged instead. Data stored on the DewK can be imported into the software,
which is a handy feature when power outages disable the network.
Are you ready for a deep dive into your data? Historical data can be viewed by sensor (model/serial number) location, or log session and displayed
in a spreadsheet-style grid. Logged data can also be exported to HTML, RTF or ASCII text for use in your analytical software, or simply print
historical data and graphs.
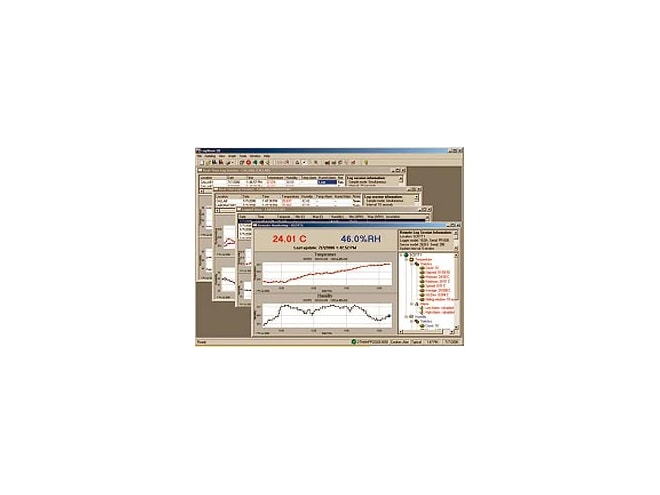
Customizable graphs in LogWare III with zooming capability are an easy way to analyze your data history, and data points that need to be
explained can be highlighted, annotated, and referred to later. LogWare III statistics include min, max, spread, average, and standard deviation
functions, and printed reports keep track of the number of temperature and humidity measurements that were found to be out of tolerance.